
Using the Geographic Component of the CCRI
1) Selection of data by census geographic units
The CCRIUID and the census geographic units fields are included in both the GIS layers, the CCRI Geographic Reference Table and the CCRI sample data. This redundancy allows for selection by a variety of means, with or without GIS tools.
Example 1: To select micro-data for Census Divisions 1-4 in Alberta
Without GIS: Using the CCRI Reference Table or the CCRI Reference Maps, determine the level of geography and CCRI Geographic ID values required for your selection.
Find CCRI Geographic ID fields
CCRICD_1921: Values Division No. 1, Division No. 2, Division No. 3, Division No. 4
The CCRI_CD_1921 alone cannot be used because Census Division names may be duplicated in different provinces.
CCRICD_NO_1921: Values 189, 190, 191, 192
With GIS: Using the CCRI GIS layers, interactively select the Census Divisions No. 1-4 in Alberta. Record or export the significant values:
CCRICD_NO_1921: Values 189, 190, 191, 192
Then In CCRI micro-data file: Select all records with CCRICD_NO_1921: Values 189, 190, 191, 192
2) Aggregation of micro-data by census geographic units It is assumed that the CCRI micro-data will be utilized in a statistical software program such as SPSS, SAS or STATA. Testing on the CCRI micro- data has been conducted primarily using SPSS. To clarify the geographic hierarchy embedded in the CCRI data it is helpful to conceptualize the data as on a series of “Levels”, from the individual up to the entire country. Data from each level can be aggregated up to the higher level, depending on the research question to be addressed. This is done by the creation of counter variables, and the summing of results based on them. The list below shows the hierarchical levels in the data, and the key identification variable for each level.
L1. Individual (INDIVIDUAL_ID)
L2. Household (HOUSEHOLD_ID)
L3. Dwelling (DWELLING_ID)
L4. Parts of CSDs (CCRIUID)
L5. Census Subdivision (CCRIUID_CSD)
L6. Census Division (CCRIUID_CD)
L7. Province/Territory (PR)
L8. Canada
The basic steps involved in this aggregation are generic and could be used with the data in any statistical software. They are:
a) Select sample data as desired based on selection criteria determined in previous section
b) Create counter variables for levels to be aggregated, Individuals, Dwellings, and CCRIUIDs
c) Use the counter variables to create aggregate level data about the variable in question at the level of individuals or dwellings in each CCRIUID.
d) Aggregate data up from the CCRIUID to the required geographic level: CSD, CD or Province level
e) Save table of micro-data aggregated by census geographic units.
The aggregated micro-data table can then be utilized in its native statistical program, or can be exported in a number of formats (Excel, DBASE, .CSV, etc) which are importable into GIS for mapping or spatial analysis.
Example 2: To aggregate micro-data on number of persons in dwellings for all Census Divisions in Alberta, and create a map representing these
a) Select and extract micro-data for all Census Divisions in Alberta
b) Create counter variables for Individuals, Dwellings, and CCRIUID
c) Count the number of members in each dwelling using the Individual counter variable, and make a new variable for Dwelling Size
d) Count the total number of sampled dwellings in each CCRIUID
e) Count number of dwellings of different sizes (1-person, 2,3,4,5,6,7,8+) in each CCRIUID
f) Aggregate the total number of sampled dwellings in CCRIUIDs by the CD identifier CCRIUID_CD
g) Aggregate the number of dwellings of different sizes in CCRIUIDs by the CD identifier CCRIUID_CD
h) Calculate the proportions of dwellings of different sizes in each CD
This data can then be exported, attached to the CD shape file, and mapped. An example appears in Figure 7.
3) Mapping of micro-data by census geographic units
Import table of micro-data aggregated by census geographic units into GIS software program. Use the common CCRI Geographic identification field (such as CCRICD_NO_1921) to join tabular data to the CCRI GIS layer. At this point, the data may be mapped using any of the GIS symbolization tools available in the program.
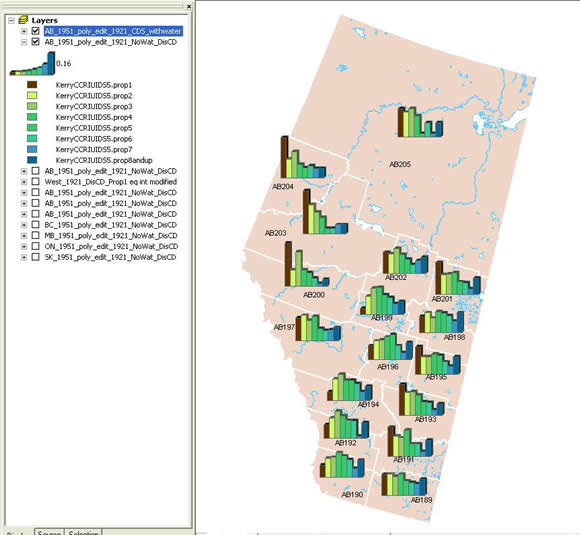
Figure 7. Proportions of dwellings by numbers of persons per dwelling by Census Divisions in Alberta, 1921
4) Use of CCRI selected published tables data files
In the work of the CCRI, the selected published tables have been useful (and will continue to be so) in a number of ways, including:
a) Provision of a geographic framework for organization of the micro-data
b) Validation of sampling data, i.e. confirmation that sample numbers extrapolate to the totals listed for each level of census geography, where possible
c) Mapping of published tables data, at different levels of census geography, for data exploration and hypothesis generation purposes. These maps may also be used for visual comparison with maps of sample data.
d) The published tables data are also useful for constructing variables relating to the local socioeconomic context of the sample. Census divisions and/or subdivisions are described regarding religion, origins, conjugal condition, etc, depending on which published tables have been selected. These could be integrated into the micro-data files as a "level" of analysis, in an hierarchical statistical analysis, for example.
The key to comparison of micro-data to selected CCRI published aggregate data is the CCRI selected published table identification field. The CCRI published table data files contain this identifier, which is the geographic location match code for the published table data, and it is also included in the GIS layers and CCRI micro-data. When linking published data to a census geography GIS layer, or when aggregating micro-data for comparison with published summary data, the published table identification field should be used.
Example 3: To link published summary data table for 1921, Vol 1, Table 38 to the CSD level GIS layer for Alberta, and map proportion of population who were Anglican
a) Use CSD level GIS layer for Alberta containing PUBLISHED TABLE IDENTIFICATION FIELDS “V1T38_1921”
b) Link data file CCRI_PUB_1921_V1T38 using “V1T38_1921” as the linking field
c) Calculate proportion of population who were Anglican (ANGLICANS_1921 / POP_tot_1921)
d) If working in GIS, map data directly. If working in Statistical software, export file and import to GIS for mapping purposes.
Example 4: To aggregate micro-data on number of persons in dwellings for all CDs in Alberta, for comparison with published data table for 1921, Vol 1, Table 38
a) to d) Follow same steps as example above in for Example 2
e) Aggregate the total number of sampled dwellings in CCRIUIDs by the published table identification field “V1T38_1921”
f) Aggregate the number of dwellings of different sizes in CCRIUIDs by the published table identification field “V1T38_1921”
g) Calculate the proportions of dwellings of different sizes in each area identified in Volume 1 Table 38.
h) These data can now be mapped for visual comparison with the map in the example above (“proportion of population who were Anglican”) or any other map generated from Volume 1 Table 38.
5) Aggregation and mapping of micro-data by census geographic classification fields, or by other geographic criteria
A number of geographic classification fields are planned to be included in the CCRI Geographic Reference Tables, and therefore may be incorporated into the CCRI sample data, to be used as a “filter” for mapping and analysis. The first of these is the CCRI_URBAN_RURAL_1921 field, which is derived from the published census volumes themselves, and may be used as an example.
There are a number of tables in the published census volumes which classify data by Urban or Rural. An example appears in 1921 Vol 3 Table 3 “Dwellings and households, classified as rural and urban, for counties or census divisions, 1921”. It was determined that the Urban classification corresponded to the CSDs listed in the KEY TABLE grouped under the headings “Cities”, “Towns” and “Villages” at the end of each CD. In the CCRI Geographic Reference Tables, the CCRIUIDs for these are given a value of “Urban”, and all others given “Rural”. To use these fields is conceptually very simple: they are used as an additional aggregation level as outlined in section 4.2 above (Aggregation of sample data by census geographic units). After counting has been done at the individual, household or dwelling level, and micro-data aggregated up to CCRIUIDs, these data would be aggregated based on whether they were “Rural” or “Urban” in each CD. In the example given above, the results would be data for CDs split into two components, proportions of dwellings by number of persons for the “Rural” and the “Urban” portions of each CD. These can then be mapped or further analyzed.
A number of additional geographic criteria will eventually be supplied as geographic classification variables which can be integrated into the CCRI sample data, and used in this way as a “filter” for aggregation.