The Geographical Component
Given the highly differentiated geography of Canada, CCRI aims to provide users with data, information, and tools enabling them to consider the spatial dimension of the phenomena they study. Special efforts have been made to reconstitute the 1911-1951 census geography, to locate (or to georeference) each sampled dwelling or household, to produce the geographic files needed to map and process the sampled micro-data and the aggregate data digitized from the published census returns, and to allow migration of the data between statistical and mapping packages. [1]
The census geographies
There are two census geographies a user must be aware of: first, there is one for the census-taking; second, there is one for the compilation and dissemination of results. Each one of them has to be understood to fully exploit the micro-data.
Census-taking geography. The census-taking geography is based upon the electoral geography. For the aim of the enumeration, each province is divided into a number of “Census districts” (CDs), corresponding to federal electoral districts, which in their turn are divided into a number of “Enumeration areas” (EAs), corresponding to polling districts. The latter is the smallest spatial unit for the enumeration itself, a zone “walked” by the enumerator, and consisting of roughly 800-1200 individuals. Those two variables (CD and EA) are found on the header of the schedules successively used to collect individual information. Census-taking geography is also used for the purpose of archival preservation and microfilming of the schedules.
Census-compilation and -dissemination geography. Compilation and dissemination (through published volumes) of census returns is done using a somewhat different geography. Here, provinces are divided into “Census divisions” (CDs), corresponding to supra-municipal entities (such as county municipalities), which are composed of “Census subdivisions” (CSDs), usually corresponding to local administration units (such as local municipalities or local improvement divisions), or where local administrations do not exist cadastral units (such as townships or parts of townships). That geography is the one with which census statistics users are the most familiar. That is also the one used by CCRI to locate the micro-data and the aggregate data and to produce geographic files to map and process them.
Thus, when addressing any geographical issue or simply locating the data, the user should keep in mind that those two geographies are different and use only CCRI geographic descriptors provided for micro-data and for aggregate data (see the geographic variables in the Data Dictionary).
Reconstituting the geographic boundaries of the census divisions (CDs) and census subdivisions (CSDs)
The boundaries of the CDs and CSDs were reconstituted using GIS software. The starting point for this was Statistics Canada’s geographic files from the 2001 census. The boundaries of these modern polygons were modified in order to create polygons for the censuses from the period under study. Each historical census polygon was assigned a CCRI geography unique identifier, or “CCRIUID.”
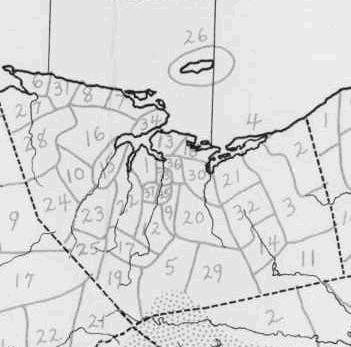
Given that the census archives consulted lacked detailed maps of CSDs (apart from a few exceptions at the end of the period under study), electoral atlases served as the primary geographic data source (see Figure 1 below). However, because the timing of the establishment of local administrative structures varied considerably from one province to another, the boundaries of the polygons were, in many cases, developed using other references (see Figure 2 below). This is especially true of the Prairie Provinces, British Columbia and Nova Scotia. Where the sources consulted do not provide a dependable delineation, a hexagonal-shaped place-holder polygon is being used to represent CSDs whose boundaries are unknown. For details on the methods and coding used for the geographic polygon files, see the document “CCRI Geodata construction guide.” (this can be found in the Resources section).
Georeferencing individuals in the micro-data samples
Each individual in the micro-data samples has been georeferenced (or geocoded), i.e. assigned a geographically unique identifier (CCRIUID) to locate them in the CSD where they lived. To do this, it was necessary to create correspondence tables between the geographic units used for the collection of census data (Enumeration districts and areas) and the geographic units used for the reporting of census data, as listed in tables of published summary data in the printed census volumes: Census divisions and Census subdivisions. Geocoding dwellings in some cases became a complex task, given that it sometimes occurs that dwellings belonging to a single Enumeration area must be matched to different CSDs. In these cases, individual dwellings, or ranges of dwellings in the enumeration manuscripts, were matched to CSDs. This process was further complicated by differences in the nature of political units, and therefore census geography, in different provinces across the country, and by changes over time. For details on how to use the CCRI geographic fields to aggregate micro-data by spatial units, and then to create maps, see section “Using the geographic component of the CCRI – examples” in CCRI Geography.
Together, these files and operations provide the CCRI’s users with a geographic way to approach the CCRI data. They offer the necessary referencing to do geographical selection of the micro-data, and produce new aggregated data. More than this, the geographic component makes it possible to do spatial analysis of the data using GIS software. For example, using GIS, it is possible to measure the representativeness of samples at various geographic scales, to group data by census subdivisions based on: census geographic units, urban or rural classification, belonging to a certain type of community. It is even possible to select CSDs, and therefore individuals/households/dwellings based on other geographic criteria. From these aggregations or selections users may do analysis on the results, or produce a cartographic rendering (thematic map) of a particular variable, or of the outcome of an analysis.
_________________________
[1] The CCRI geography sub-group was formed by members from Université Laval (responsible for Quebec and Atlantic Provinces) and from the University of Toronto (responsible for other provinces and territories). Colleagues from Memorial University and the NLSA were involved with respect to Newfoundland before its entry into Confederation. For further information on the CCRI geographic information and tools, see St-Hilaire, Moldofsky, Richard, and Beaudry (2007) “Geocoding and mapping historical census data: The geographical component of the Canadian Century Research Infrastructure”. Historical Methods, 40:2, 76-91.
Figure 1. Part of the riding of Essex South ON, Electoral Atlas, 1915.
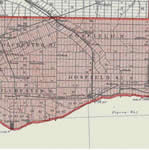
Figure 2. CSD from the CD of Pictou NS 1911, Andrew H. Clark.